Make Mathematical Graphing Lessons Interactive with Desmos
Nicole Mathew
Curriculum Specialist
News
Teq Supports District Implementation: Beyond funding guidance, Teq provides turnkey grant alignment, hardware staging, and certified PD coaching via OTISpd.com to ensure 100% classroom adoption.
Are you looking for a way to make your graphing lessons more interactive? Now it’s easier than ever to incorporate interactive graphs using Desmos in Lumio. Desmos is a free tool that allows you to add blank graphs, plot points, line equations, and even images that are oriented on the graph! Graphs can be created as standalone activities or can be added to any Lumio lesson including those containing pages from uploaded content like PowerPoint or Google Slides. You can even start a Desmos activity instantly from within an active lesson if you need to add a graph on the fly. Students can engage with a Desmos graph activity on the SMART board or individually, using their own devices when content is pushed out via Lumio.
How to create a Desmos graphing activity:
- Login to your Lumio account
- Click the green activities button to create a new activity or click the blue plus sign from within an existing Lumio lesson.
- Choose Desmos at the top of the page
- Once your graph has been created, click the plus sign at the top of the window to add a folder for organization, a table for plotting points, an image, note or f(x) expression.
- Click on the keyboard icon to easily add functions and mathematical symbols.
- When you’re all done, click “finish”
How to create a Desmos activity from an active lesson:
- Start the Lumio lesson
- Click the plus sign on the left side menu
- Choose Desmos to launch the activity
Take a look at this video walk-through:
As you can see, Desmos is a powerful graphing tool that is easy to implement with your students. Please note that the edits made to a graph during a live lesson will not save. When you end the lesson, work done by either students or teachers will not be recorded for later reference. If you want to save class notes or student work, consider using the screen capture tool on the SMART board or have students take screenshots on their individual devices.
For more tips, tricks, and tools for teaching in and out of the classroom, check out more articles on the Teq Talk blog.
We also offer virtual professional development, training, and remote learning support for educators with OTIS for educators. Explore the technology, tools, and strategies that can spark student success — no matter where teaching or learning are happening.
0 thoughts on “Make Mathematical Graphing Lessons Interactive with Desmos”
Related Articles & Other Recommended Reading

Reflecting on the Past Year: Questions to Assess Your EdTech Success
Congratulations! You’ve made it to the finish line, and summer is here! All of your diligent work and dedication have paid off, and now it’s time to enjoy your hard-earned rest. After the noise of the previous school year fades, being in the classroom is likely the last thing on your mind. As a former […]
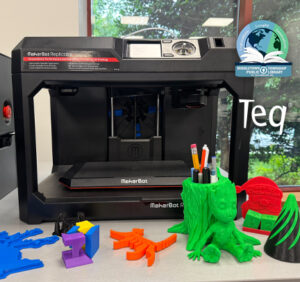
Customer Spotlight: Middletown Township Public Library
How One Library Built a Community Hub for Creativity, Connection, and Innovation When people think of libraries, they often imagine books, research, and quiet study spaces. At Middletown Township Public Library, those services remain central to the library’s mission, but today’s visitors can also design custom apparel, engrave personalized gifts, create prototypes, and learn new technical […]

How to Safely Store Your AR/VR Headsets for the Summer
As the school year comes to a close, properly preparing your AR/VR hardware for summer storage is essential to extending the lifespan of your investment. Taking a few deliberate steps ensures that when teachers and students return in the fall, their headsets, controllers, and charging carts will be clean, functional, and ready for classroom use. […]